100 years?
What will the church look like in 100 years?
By Mike Crudge – Director of the Carey Centre for Lifelong Learning
This article has been re-posted with permission. The original can be viewed here.
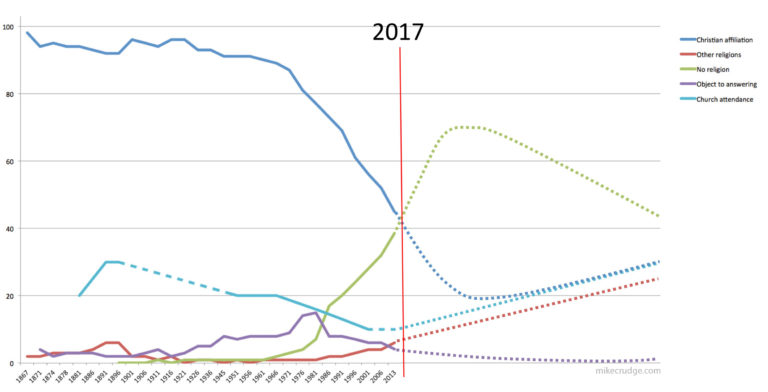
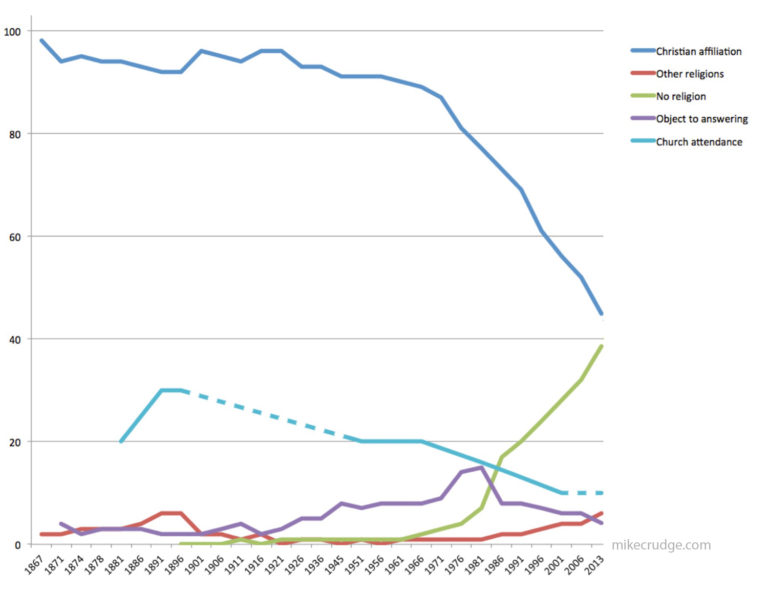
This graph shows the last 150 years of New Zealand census religion data and church attendance, plus my prediction for the next 100 years. Over the last few weeks I’ve been part of a conference with Christian Savings, Laidlaw College, and the Carey Centre for Lifelong Learning, where I talked around the idea that “something is different now” in terms of the relationship between church and society. This blog post is part of that talk. I debunk some of the hype around some census figures, and give two possible future scenarios for the church in New Zealand.
Looking at the census data in the graph below, the top line on the graph: Christian Affiliation – this is the line we hear sensational headlines about in the media when census results are released: about the church dying as this line on the graph plummets toward zero…
The vertical axis is percentage of adults, and horizontal axis is time from 1867 to 2013.
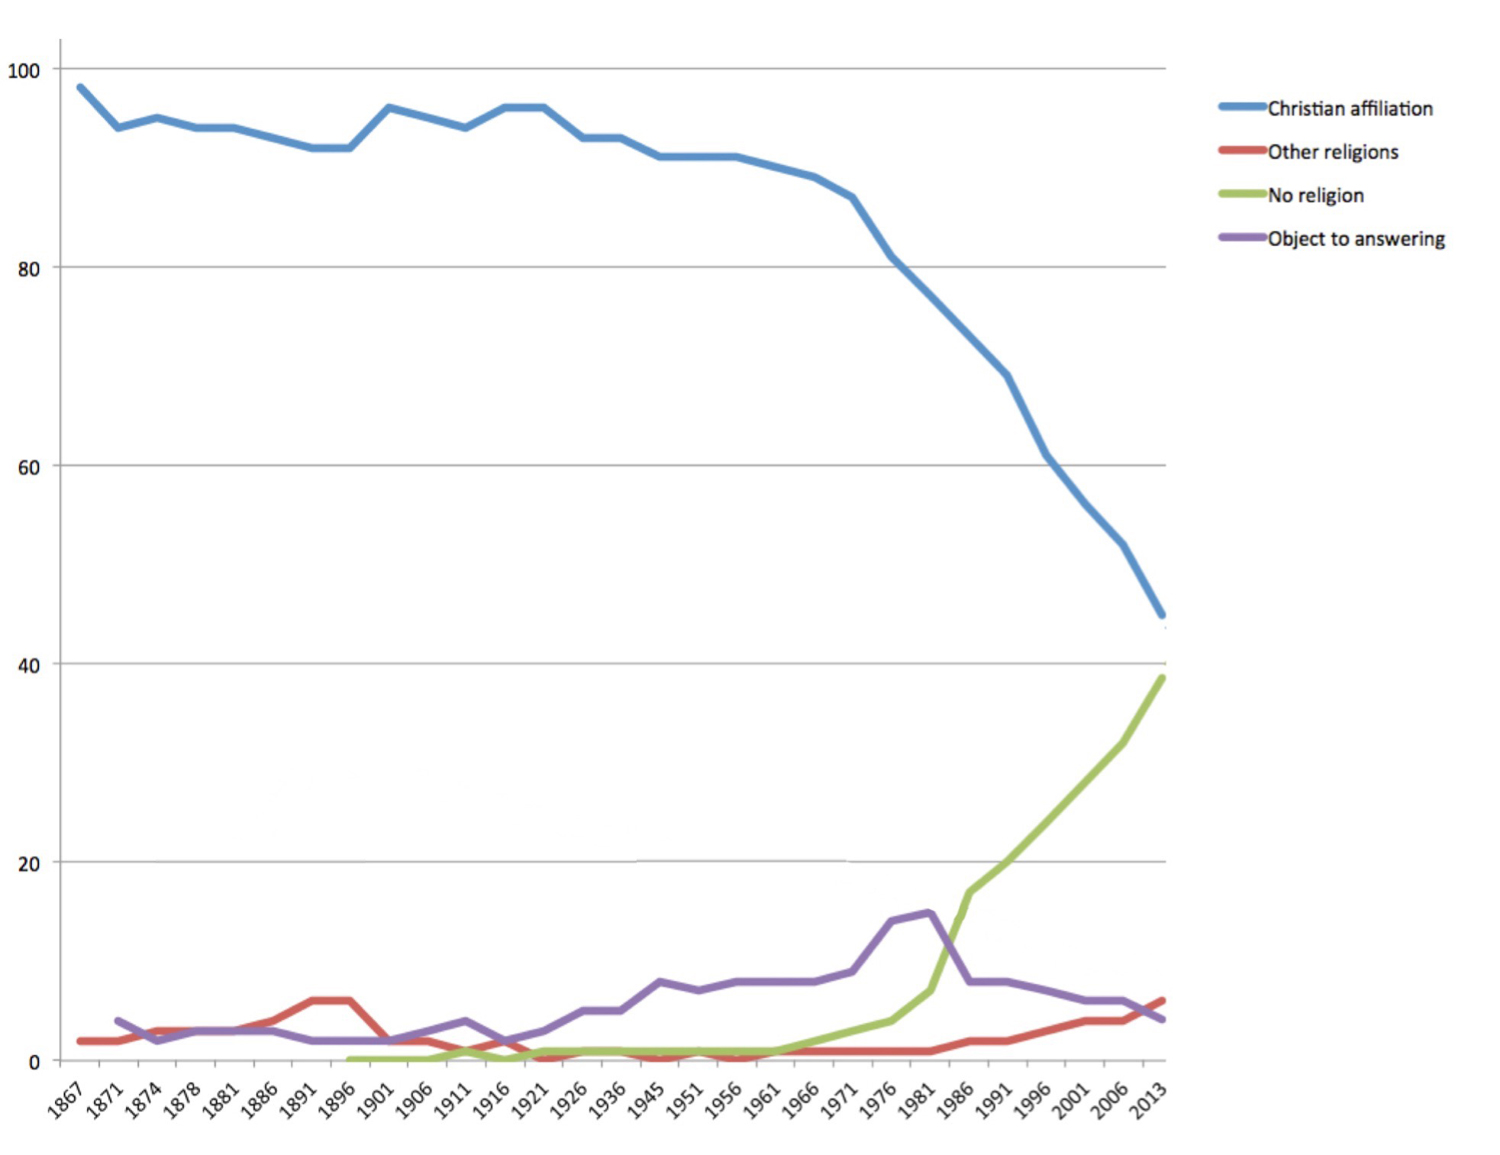
I don’t think we should believe the stories of doom! There is some bad news for the church, but I don’t think this is it.
I don’t think this downward line matters at all: what we’re seeing as this line falls is a correction in the data that will eventually match what the reality is.
As a comparison
This pie-graph shows current religion in Thailand. The yellow shows 93% are Buddhist.
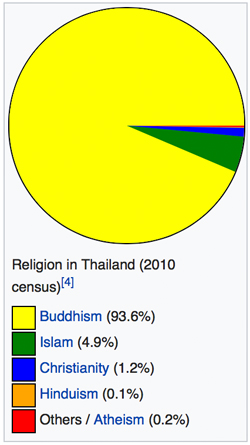
I first went to Thailand in 2001, the Kiwi friends I went to visit were working with Buddhist monks – teaching them English. Looking at this pie chart, you’d think nearly everyone in Thailand was Buddhist. They might be culturally Buddhist, but not practicing Buddhism – there’s a massive difference between a cultural identity, and the following of a religious faith. My friends told me they had discovered that for Thai people: “to be Thai, is to be Buddhist” – which doesn’t mean they are Buddhist.
150 years ago in New Zealand
Think about where the Pākehā colonizers came from 150 years ago: Christian Brittan. A culture that had centuries of Christian influence shaping it.
In the first New Zealand census in 1851, I think “to be a coloniser, was to be Christian.” 93.35% ticked the Christian box (interestingly, the same amount that are currently Buddhist in Thailand – it’ll be interesting to see the figures in Thailand in 150 years from now).
I think most followers of this blog would agree: that to claim affiliation to a cultural identity shaped by an historical religious framework – does not make you a follower of that religion.
A correction
What we have with the downward line on the census graph, are people deciding they no longer need to have a cultural Christian Affiliation, and they’re now happy and able to say “No Religion” – which is the increasing green line (I don’t think “No Religion” was even an option for a long time in the census.)
Eventually, the downward blue line will level out at roughly the amount of what I would describe as active-participating-followers-of-Jesus: the church. I don’t like to use the descriptor, but maybe the blue line will eventually represent actual Christians (I know – who am I to judge? – but I hope you see what I mean: the difference between participation compared to identity-only).
This plummeting line on the graph, what I’m calling a “correction” to reflect reality, Pew Research refer to as “Religious Switching”.
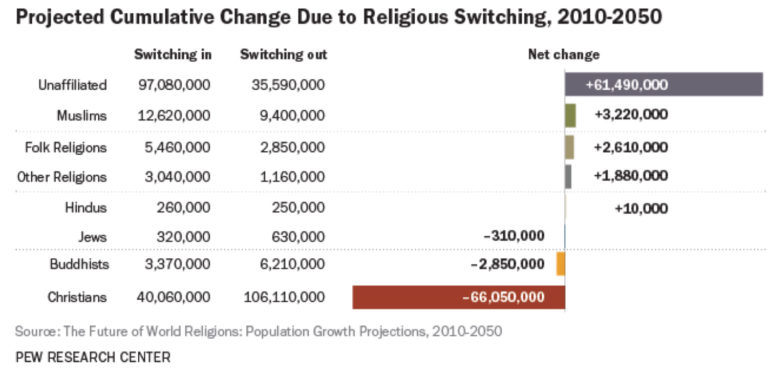

These are global figures projecting the change between 2010-2050
They are suggesting: Christians globally will drop by 66 million. Unaffiliated will grow by 61 million.
This doesn’t mean 66 million people will lose their faith, it just means they will be able to articulate a different cultural association – one that matches their reality: of no religion.
This data matches my predication with the blue line on our census graph: that it will eventually reflect actual Christians not cultural Christians.
Pew also have this chart:
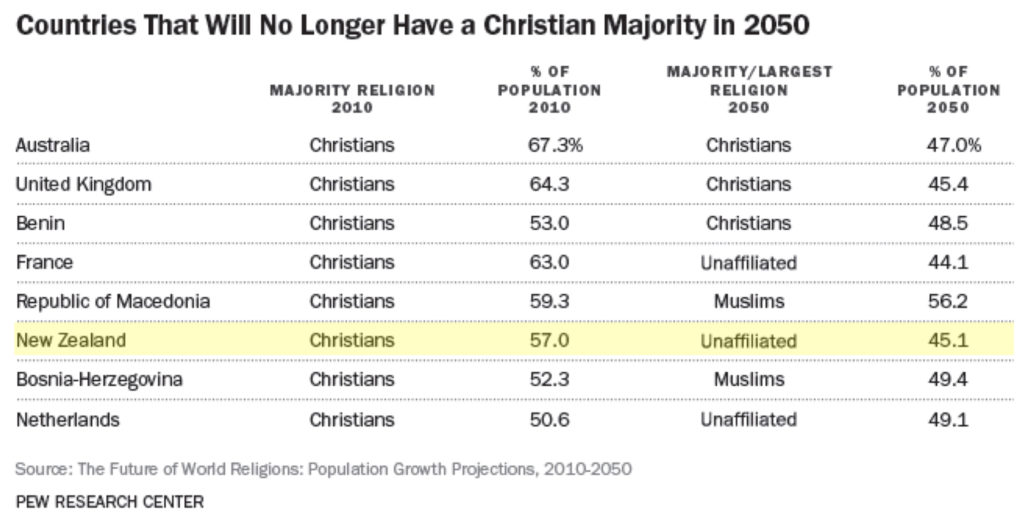
This chart is showing that New Zealand won’t have a Christian Majority in 2050 – they’re using Christian Affiliation figures – to suggest in 2010 57% of New Zealanders were Christian – that’s a cultural reference not a reality reference – the church was no where near that big in 2010.
If you hear media hype around this – that the church is dying – don’t believe it – it’s scare-mongering.
We don’t have a Christian majority now – what we have is a cultural identity with an historical Christian framework that is declining rapidly.
The actual church?
The data that is more significant, that might be a better indication of the church in New Zealand is this:
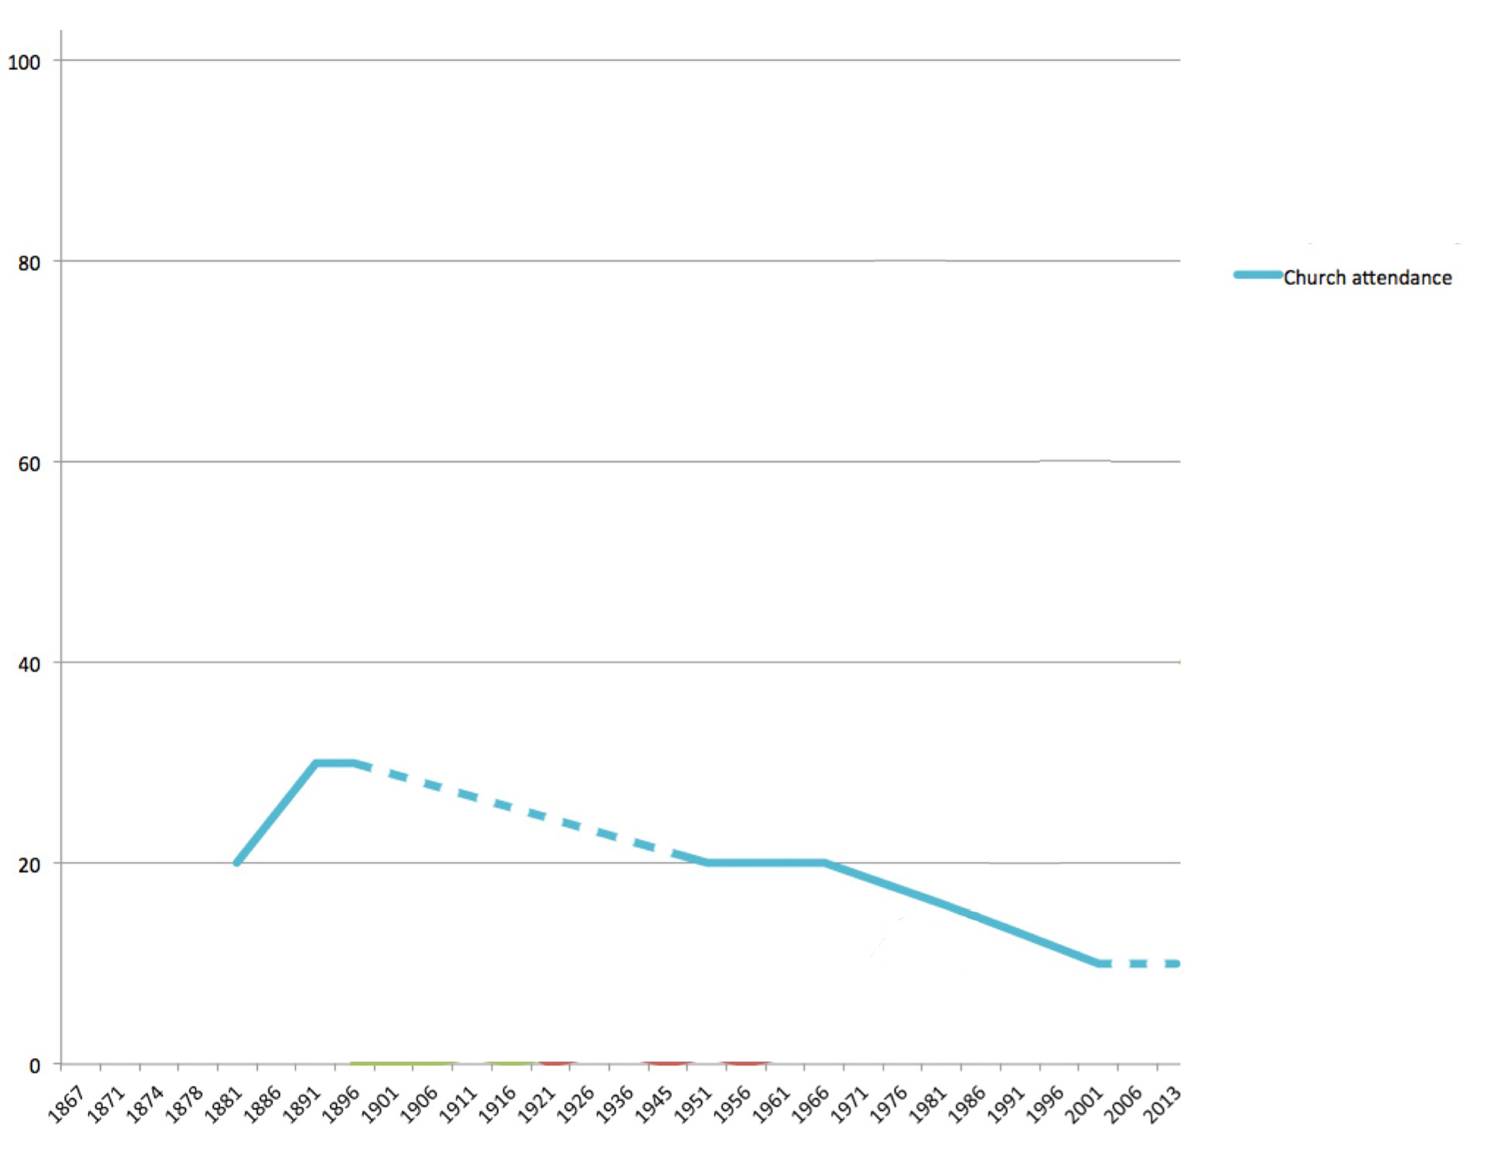
This is a rough graph of church attendance in New Zealand – across the same time period (percentage of adults on the vertical axis, time on the horizontal from 1867 to 2013)). The data is rough and incomplete – I talk more about this graph here in a post about when church attendance peaked in New Zealand… This line is an attempt to show regular church attendance of adults – as a percentage – by counting bums on seats at Sunday church services.
Assessing the state of the church by bums on seats is a pretty rough way to measure.
While you can be a follower of Jesus and not turn up regularly to church services – I do think regular participation in a local church community is a good indicator of “actual” Christians, rather than “cultural” Christians.
A new way to measure the church
As an aside: I’d be interested in coming up with a new way to measure how the church is going. What about this list forming some new measurement Key Performance Indicators (KPIs) of the church:
- good news to the poor,
- released captives,
- sight recovery,
- freedom from oppression,
- proclaiming the Lord’s favour.
This list comes from Luke 4:18-19, the bit from the prophet Isaiah’s scroll that Jesus read out as a manifesto at the beginning of his Gospel ministry. That’s what Jesus set out to do. Could that be a way of defining what the church is to set out and do?
The reality is, it’s much easier to count bums on seats.
The 1890s peak
Looking at the graph above – from the data we have, church attendance peaked in the 1890s – at 30% of adults attending. I think that’s a much better indicator of the church than the census affiliation numbers at the same time. New Zealand church attendance then is lower than in Great Britain at the time, which may have been 40% or more.
The right thing at the right time
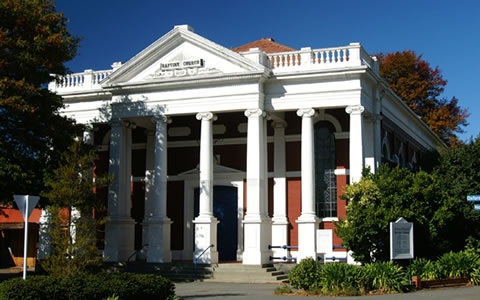
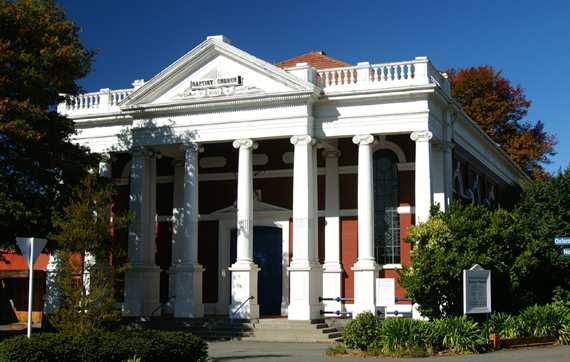
The photo below was the Oxford Terrace Baptist Church building in Christchurch, New Zealand. I was an assistant minister there for 6 years from 2009. This building was destroyed in the 2011 earthquakes and no longer exists.

A close up of the top text:
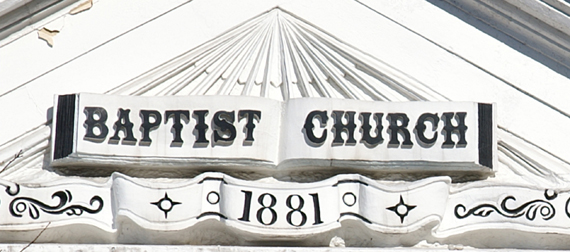

This church building was built in 1881. They built that impressive building a decade before church attendance peaked in New Zealand. It was literally a case of “build it and they will come” – they couldn’t lose! There are stories of it being full to overflowing several times each Sunday for many decades.
I like to think they had their finger on the pulse as they sought to discern what was needed at that time and into the future. There will be similar stories throughout New Zealand. Those must have been exciting times for the church.
A strong minority
Current regular church attendance probably sits around the 10-15% mark. I think this is an indicator that 10-15% of New Zealanders are probably active, participating, followers of Jesus. Together we’re a strong minority.
In the graph below I’ve added the church attendance line to the census data:
 What will the church look like in 100 years?
Now I want to predict 100 years into the future.
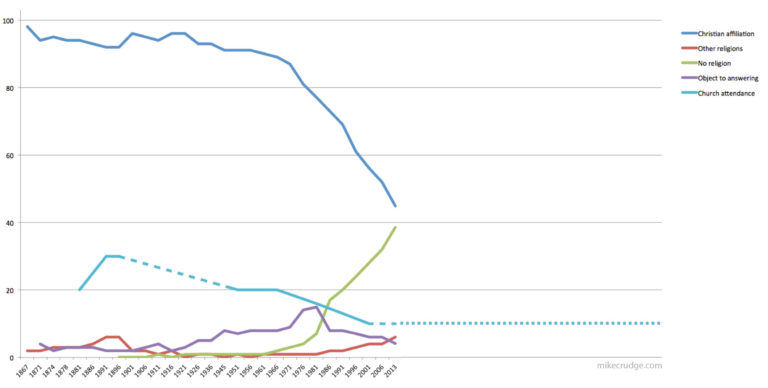
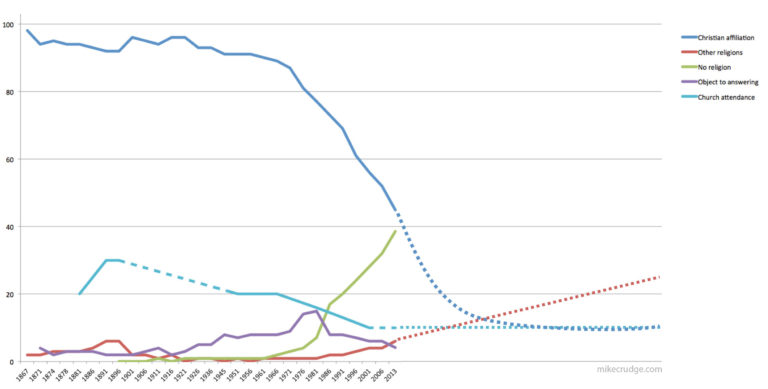
In the graph above I have added a church attendance line 100 years into the future that stays constant at 10% of the adult population. Imagine if the church stayed the same – we continued to be 10% of the population for the next 100 years.
This would actually mean the church grows significantly over the next 100 years, obviously as population increases, the size of the 10% increases too – so this is a pretty optimistic scenario: we stay the same percentage AND grow bigger.
As shown in the next graph, the Christian Affiliation line will correct itself and be in line with however we end up measuring the church. This is the so called Religious Switching of Pew Research:
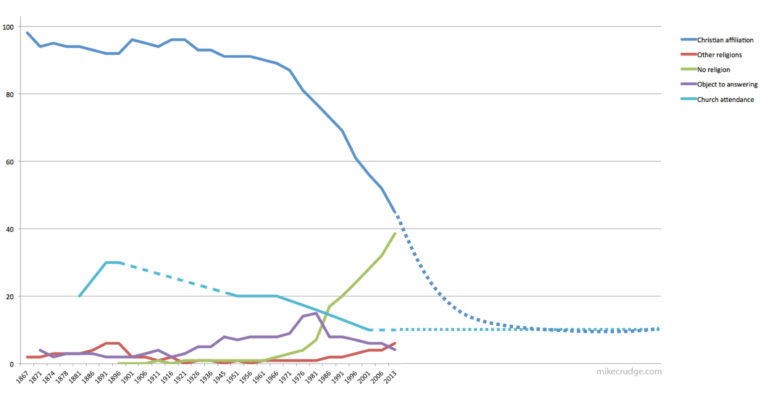
In this scenario I’m guessing Other Religions will continue to increase – mostly with immigration – as shown in the next picture. I’ve drawn this as linear, reaching 25% in 100 years – but it might end up being exponential and much higher depending on our immigration policy…
Object to Answer will dwindle – people will be happy to tick No Religion, and No Religion will peak and then diminish as Other Religions increase:
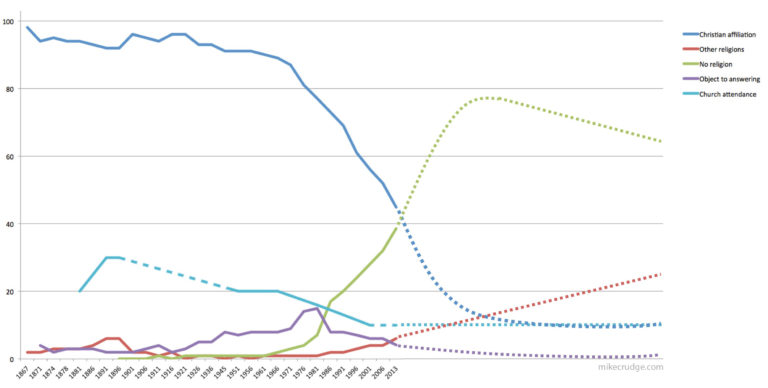
Do you think this is possible? Is this a realistic projection?
Could the church match the historical peak?
I’ve got one more scenario:
What if, over the next 100 years, the church grew back to its 30% peak – so in 100 years, 30% of New Zealanders were active followers of Jesus:
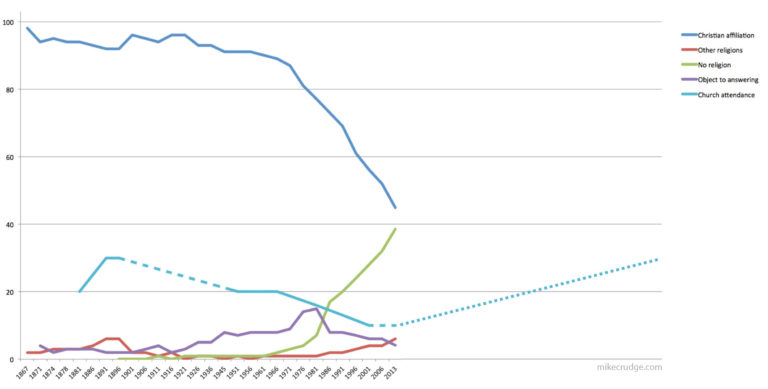
The other lines could end up looking like this:
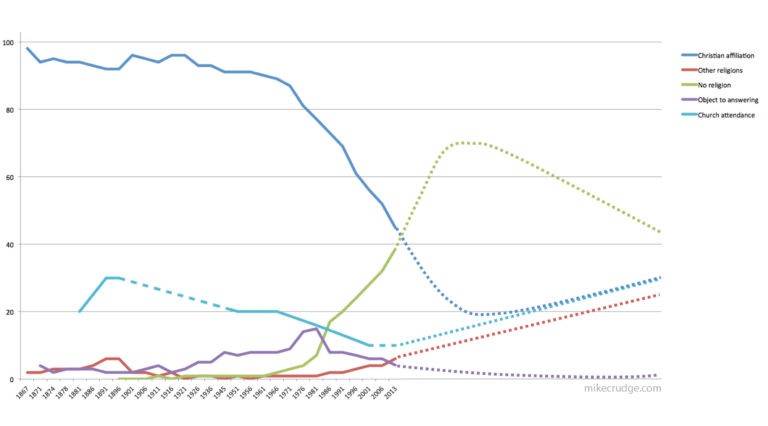
Can you imagine that happening?
Imagine if in 100 years nearly a third of New Zealanders were active followers of Jesus.
Coming back to 2017 – I’m interested in the things the church needs to consider now as we plan the next 100 years:

What are your thoughts on all of this?
Imagining the church in 100 years is a way to introduce ideas that help us consider what to do now as we plan for the future. In a following blog post called 5 ideas that shape church and society engagement, I run through five ideas that I think help us situate the place of the church in society – five ideas that help us critique and potentially adjust our engagement – helping us get our finger on the pulse at this time as we plan for the future.
Read more about 5 ideas that shape church and society engagement here.

Mike Crudge’s blog focusses on issues that in some way connect with communication, church, and society. These topics overlap with others such as theology and missiology, so if you’re interested in things like the mission of the church, being missional, or evangelism, you might find something of interest on it.
Mike currently lives in Auckland and is the Director of the Carey Centre for Lifelong Learning, which is part of Carey Baptist College, New Zealand’s Baptist theological college that has an ecumenical mix of students focusing on applied theology, pastoral leadership and mission training. Before that, he was a pastor at Oxford Terrace Baptist Church, Christchurch.

